Monitoring Processes Using The Jobtop Utility
Introduction
If you run jobs on an HPC cluster, there are many things that may go wrong. A common occurrence is that your program does not use the requested resources the way you expect or that a program's actual behaviour differs from what was requested in the qsub options. If this happens, you may get poor performance, or other users may be affected.
Examples
- Processes are not correctly distributed across selected nodes.
- The number of processes is greater or less than what you expect.
- A program running in a sequential job starts many threads.
- A program uses much less memory than you reserved, causing underusage of an overbooked system.
- An MPI job has the correct number of processes running on each node, but several or all of them crowd the same CPU.
Commands like qstat -j jobid and (after the job finished) qacct -j jobid tell you which resources were reserved by SGE for your job, but you get very little information how these resources are or were actually used.
For this purpose, you may monitor your running jobs using the locally developed jobtop utility. This program opens windows on your X11 display, one per host assigned to the job by the batch system, and runs the top(1) command, displaying relevant parameters of your processes.
Prerequisites
To use jobtop, you need an X11 server running on your PC, and an SSH-session to the login node of the respective cluster with activated X11 forwarding. To check, login to the cluster and issue the xterm command. If no xterm window appears, fix the problem - if necessary, please consult our getting started pages.
All locally developed commands described below reside in /usr/site/hpc/bin. This directory is currently not a component of the default $PATH. You may want to add this to your PATH in your $HOME/.bashrc.
Checking Your Program Locally
Before submitting your program as a job to SGE, it makes sense to perform small sample runs on the login node to get a feeling for how the program uses resources (CPU, memory, etc.) Typically you would do controlled test runs for various problem sizes to determine the scaling behaviour of your software.
Open two windows logged in to the cluster's login node. In one
window, enter the command
/usr/site/hpc/bin/hpctop -u $USER
which starts the top(1) command in the special configuration
described below.
In the other window, run your test case. In the hpctop
window, watch the program's resource usage, expecially the number of
processes (displayed individually)
and threads (nTH), memory usage (VIRT and
RES), and CPU usage (%CPU). The program's memory usage
will give you an indication how much memory to request in the
#$ -l h_vmem
option for the qsub command. Please note that jobs exceeding
their allocated h_vmem may fail silently or with misleading
error messages.
For more details on top, see below.
Using Jobtop to Monitor Your Running Jobs
First, get a list of your running jobs. Optionally, get detailed resource info on your job. Then start jobtop for your job.
qstat -u $USER
qstat -j jobid
/usr/site/hpc/bin/jobtop jobid
For each host selected by the batch system for your job, a separate window is opened, running a preconfigured version of top(1).
Example
The following example demonstrates jobtop usage with a standard HPC benchmark (HPL - portable High-Performance Linpack Benchmark).
The job requests 12 job slots with 4 processes per host and 2260MB for each process. Before starting the actual benchmark, the job collects some job details (date, hostname, some SGE variables, SGE hostfile) for the record.
After submitting the job (qsub run.sge) we check that it is running (qstat -u $USER).
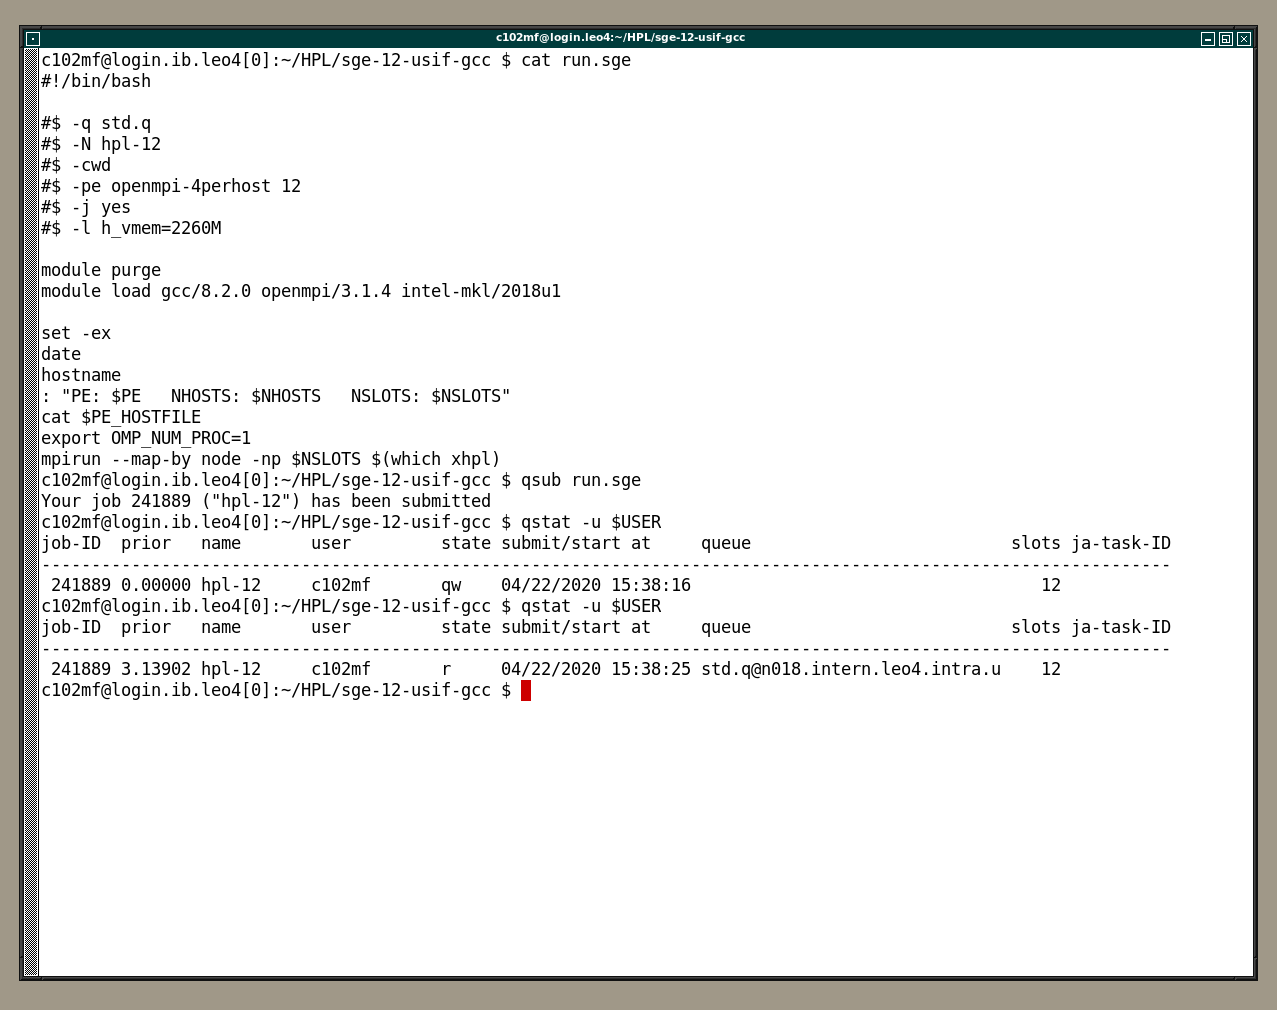
Once the job is running, the allocated nodes are known to the system, and we can start jobtop specifying the job's ID.
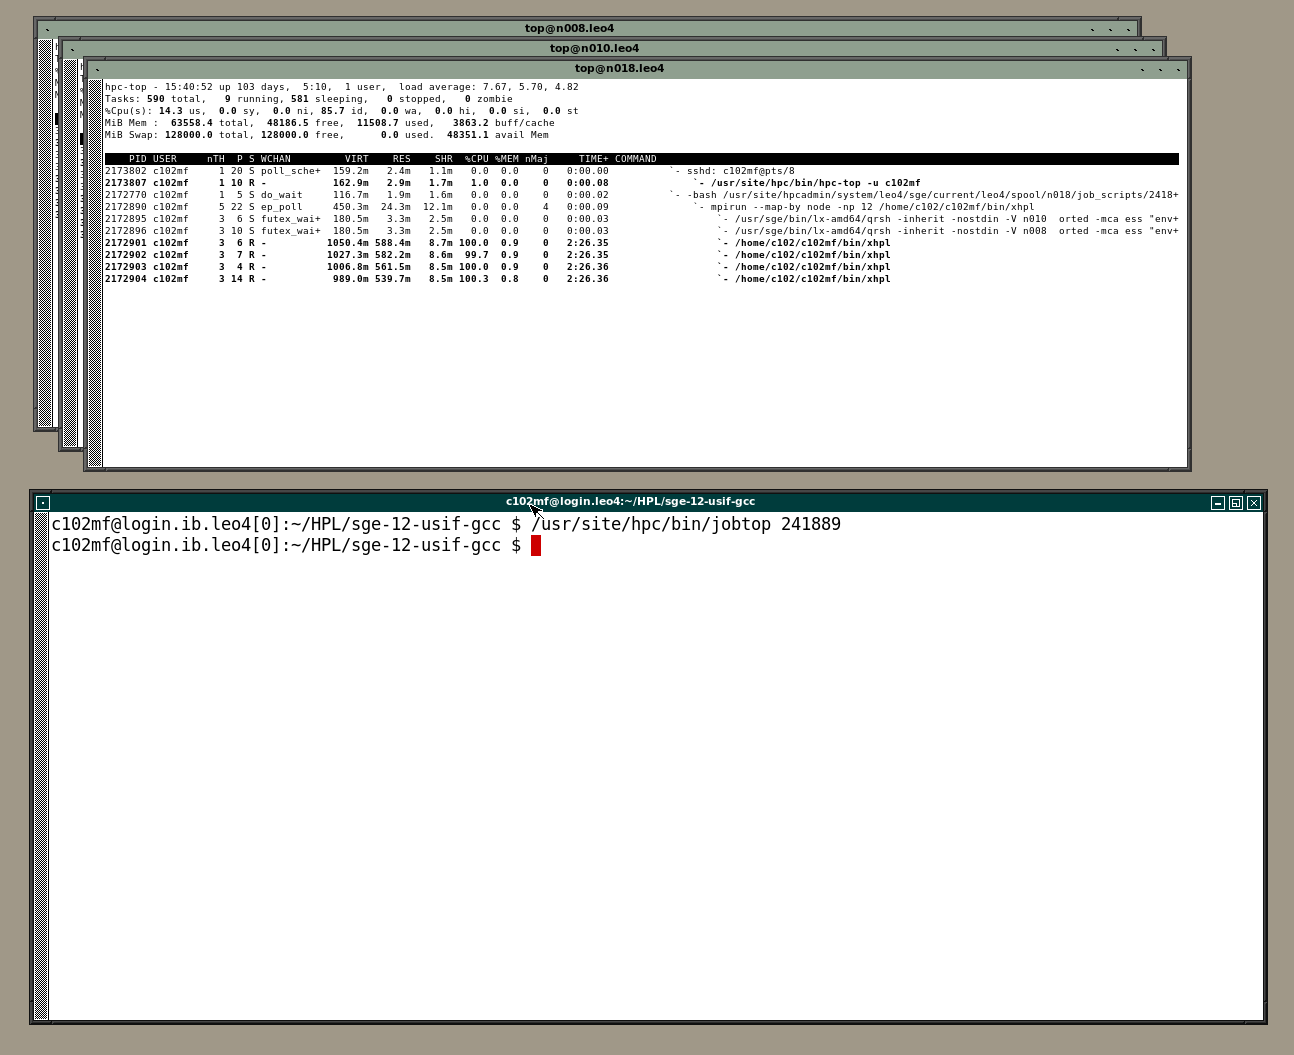
As expected, the job is running on three nodes, so three windows running a preconfigured top command on each node, have been opened. Depending on your display, the fonts may be too small to be legible. Adjust the window size and the font size (click and hold <CTRL>-<RIGHT-MOUSE-KEY> anywhere in xterm's text window to get the font popup menu) to your needs, and you will get something like
Top Usage Hints
Description Of Top Output
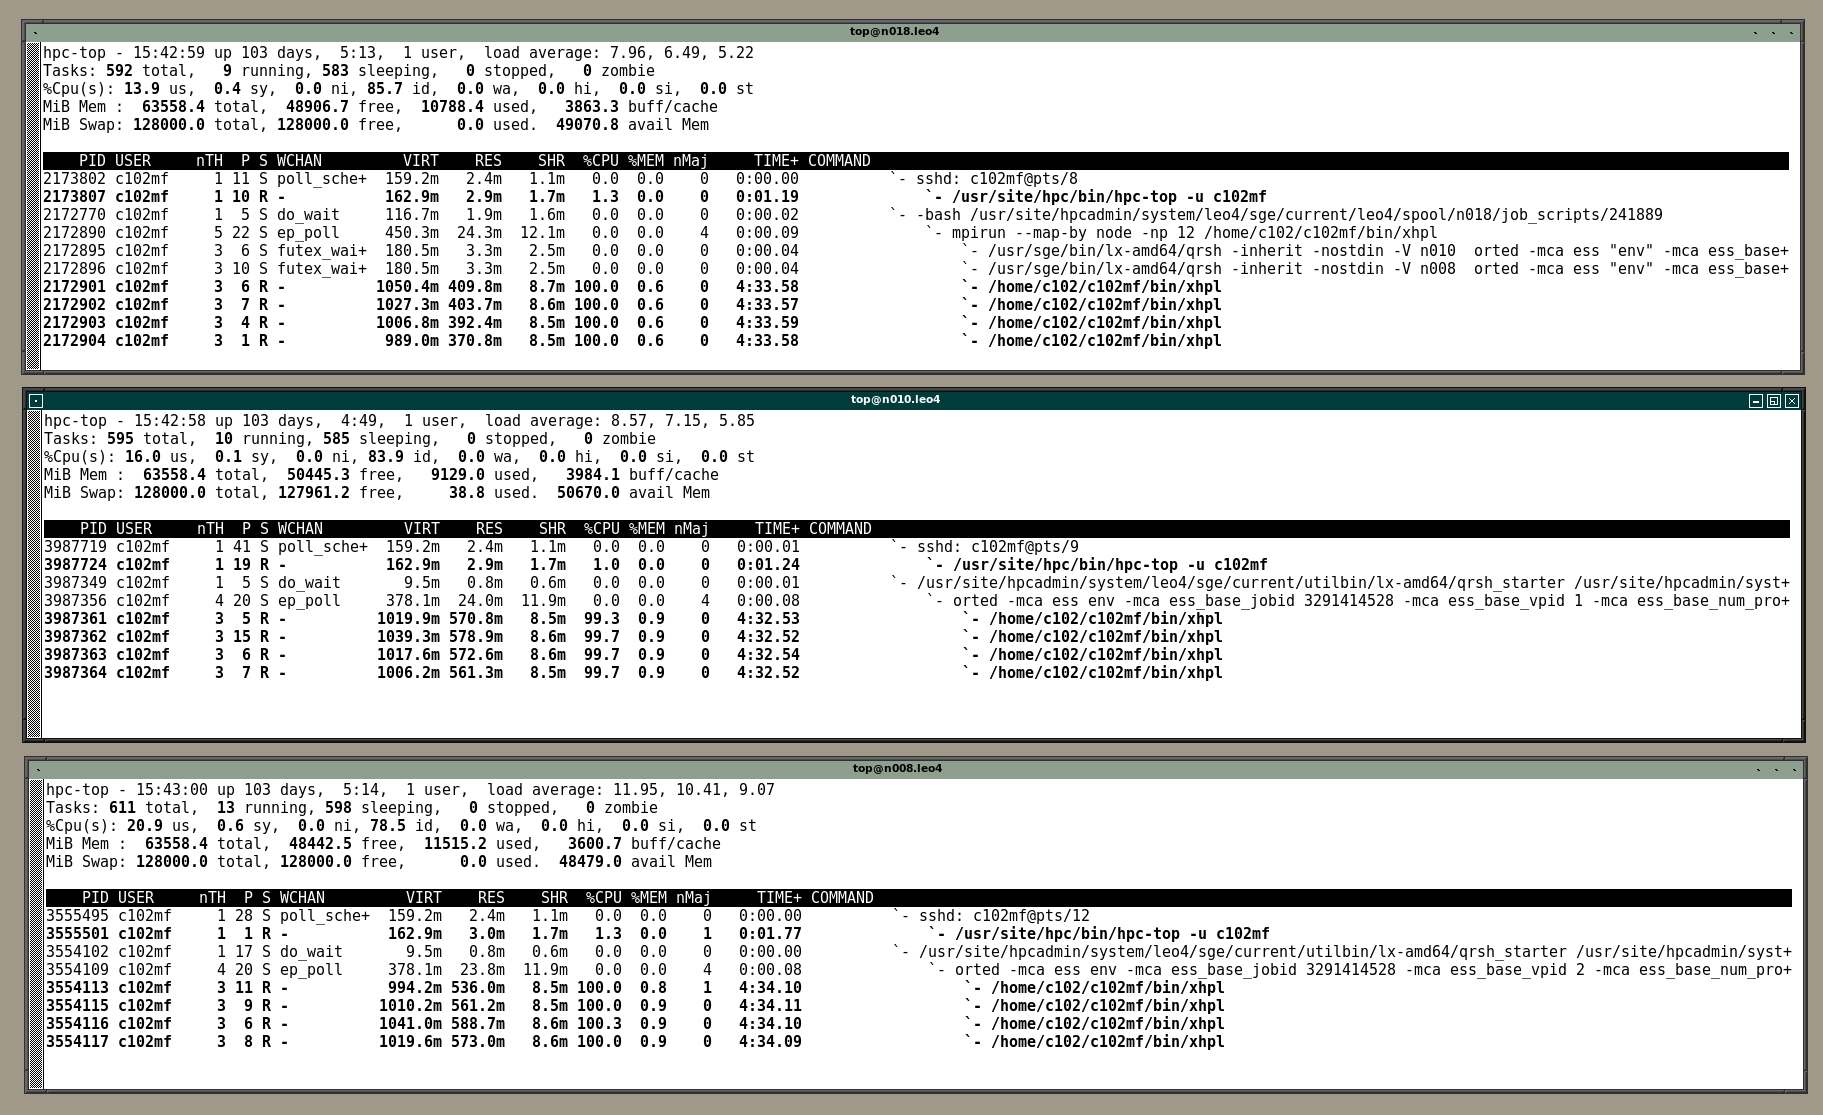
The three windows are arranged with the master process (mpirun) in the upper window. Processes are displayed as trees in each window so you can easily understand their relations.
The indovidual fields (for details, see man top):
- PID, USER: process ID and owner of process.
- nth: number of threads. In this example, each process has three threads, but only one is active. If you want to display individual threads, hit the <SHIFT>-<H> key (toggle threads on/off). Check threads if each process has more than one active thread.
- P: Last CPU (Processor) used.
- S: Process state (R: running, S: sleeping, etc.)
- WCHAN: reason why process is not running.
- VIRT: total virtual memory allocated to process (code, static data, stack, and heap). If this exceeds SGE's -l h_vmem, the process should be automatically terminated by SGE.
- RES: memory resident in actual RAM. If this is less than VIRT, then either the process has not accessed all its allocated memory, or your programm overallocates memory (unfortunately not an uncommon practise).
- SHR: the amount of shared memory.
- $CPU: The amount of CPU resources used. This should be close to 100% per CPU-intensiv processes for properly set up jobs, adding up to the number of CPUs reserved in the parallel environment. If CPU usage is significantly less than 100%, you may be experiencing poor balance, if it is more, your processes are running more than on CPU-intensive threads (hybrid job), which needs special arrangements.
- %MEM: Fraction of total memory occupied by process.
- nMaj: Number of major page faults. If more than a few dozens are displayed and their number keeps increasing, this means that the total amoonut of memory used by all processes in the host exceeds its physical memory. This should never happen and is a sure sign that some processes are using more memory than allocated by the batch system.
- TIME+: used CPU time accurate to 1/100s.
- COMMAND: command line. Commands are arranged in tree fashion so you can easily see the relationships.
The processes shown in above example are well-behaved with two exceptions:
- The processes are correctly distributed to all three nodes matching the PE request -pe openmpi-4perhost 12
- All of them use almost exactly 100% CPU each.
- Each process uses a different CPU.
- Practically no page faults.
- But:
- Virtual memory is only half of the requested in the -l h_vmem=2260M directive. Here we are running the HPL benchmark and have dimensioned the problem size using the HPL Tuning Guide.
- The same is true for the resident memory, which is again half of allocated memory, resulting in a four times overallocation.
If you experience this situation, keep monitoring and watch how memory usage evolves. If memory is underused throughout execution, reduce memory allocation to be more realistic, in particular if you are reserving lots of memory. This will help getting more jobs run in the same period of time.
In above example, it appears that the HPL tuning guide overestimates needed memory by a factor of almost two for this problem size, and that the HPL benchmark overallocates memory, again by a factor of two.
Operating Top With Keyboard
Top is a curses(3) based utility and responds immediately to key presses. Upper/lower case is significant. <h> displays a help screen with the most common options. For details, consult man top.
Some useful keys:
- <E> (Uppercase E)
- Toggle Threads / Processes view
- <V> (Uppercase V)
- Toggle tree view
- <e> (lowercase e)
- Cycle units of memory usage displays (KB, MB, GB, TB...)
- <q> (lowercase q)
- Quit current display or the top program
Implementation Details
The jopbtop command uses parameter settings stored in $HOME/.hpc-toprc (i.e. different from the standard $HOME/.toprc). This file will be created upon first use of jobtop or one of its components (rtop, hpctop). You may change the settings according to your needs and use hpc-top's W command to make changes persistent. Remove the file if you want to start with clean settings.